.svg)

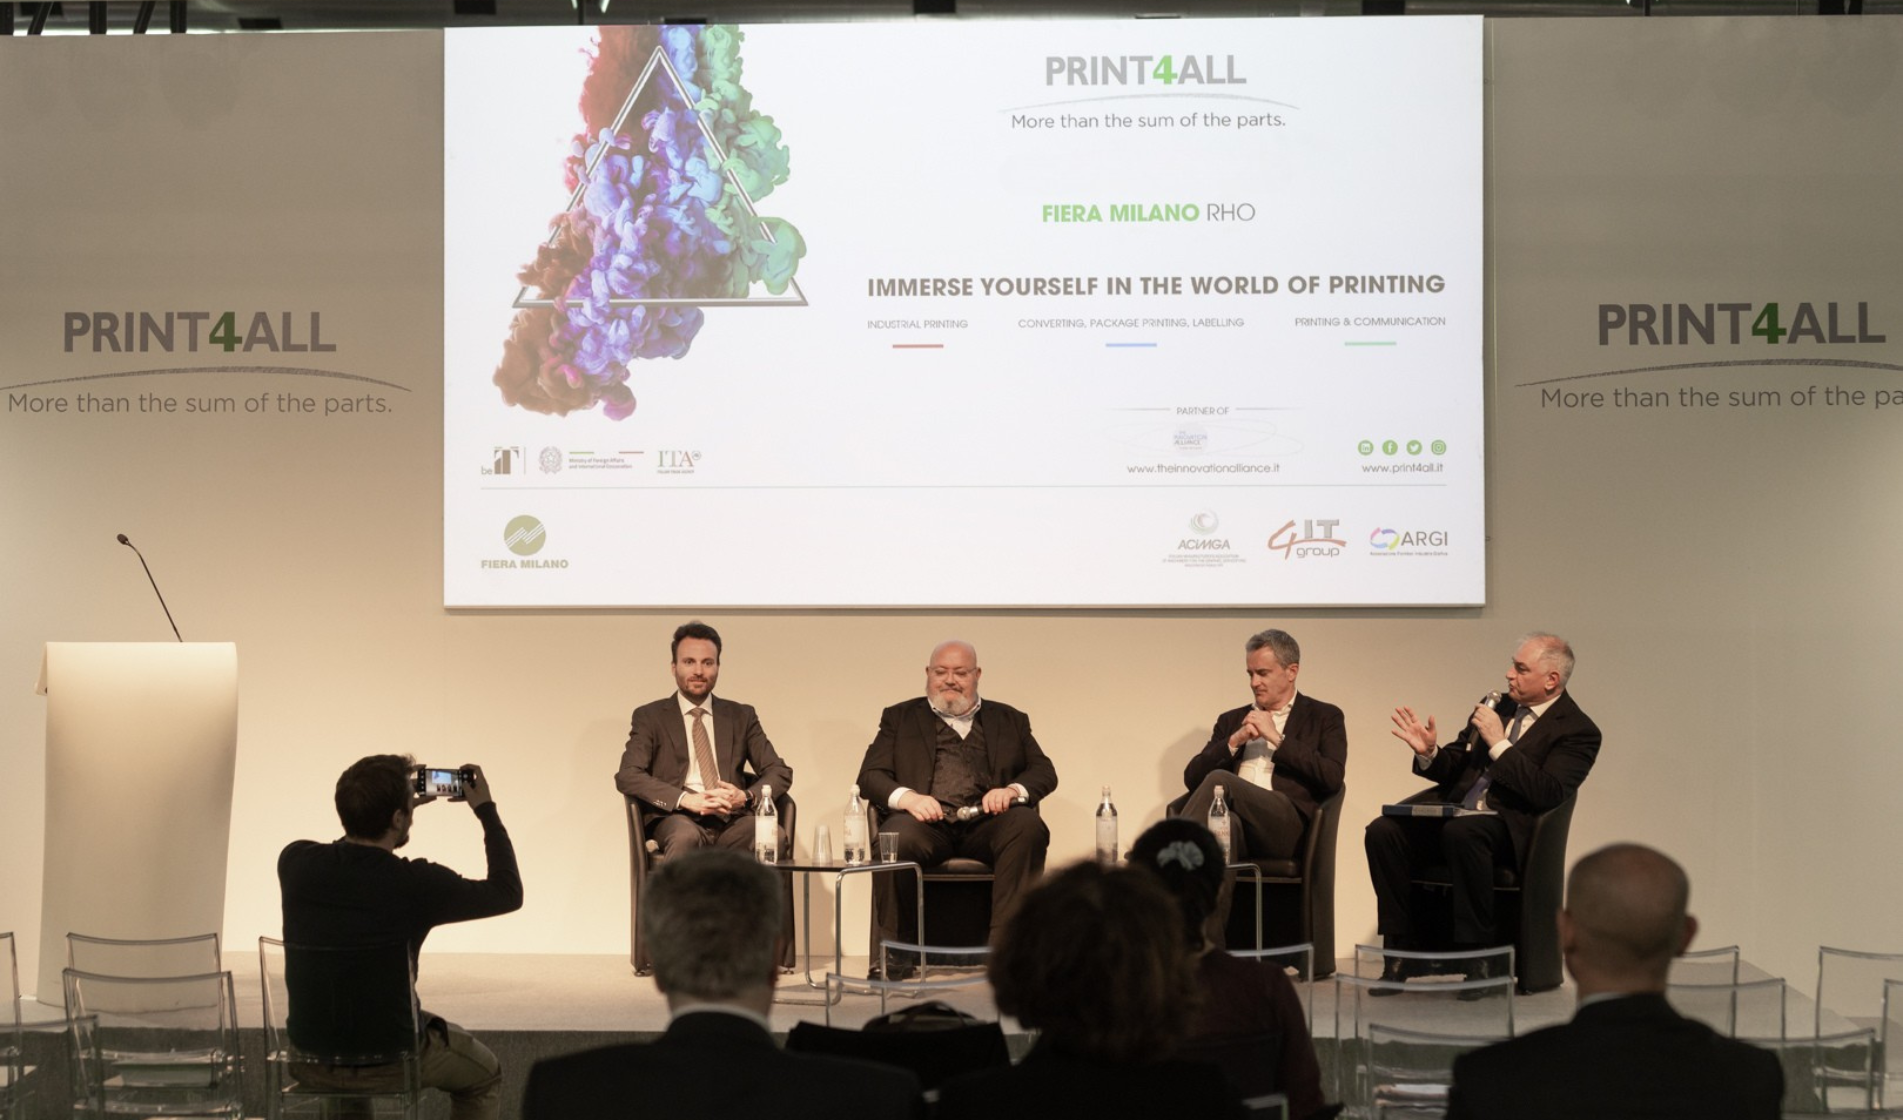
THE TICKET OFFICE IS OPEN! GET READY FOR PRINT4ALL: REGISTRATIONS ARE OPEN
The exhibition opens in a few weeks. Secure your ticket and visit Print4All and the other events of The Innovation Alliance.
GET YOUR TICKET
THE TICKET OFFICE IS OPEN! GET READY FOR PRINT4ALL: REGISTRATIONS ARE OPEN
The exhibition opens in a few weeks. Secure your ticket and visit Print4All and the other events of The Innovation Alliance.
GET YOUR TICKET GET YOUR TICKET
History sometimes repeats itself, as argued by Giambattista Vico. Scenarios can change, evolving rapidly, driven by the fury of technology, sometimes by human folly or even by unforeseen (more or less) 'natural' phenomena. In May 2019, when analysing the 2017 results of the companies in the various panels, many institutions commented on this. In particular, among many, the Centro Studi Confindustria in one of its notes at the time reported that 'on the basis of a large sample of balance sheets of Italian industrial companies, it appears that operating profitability has practically returned to pre-crisis levels, but bank credit is less available after the financial crisis of the past few years'. At the time, the world was grappling with the consequences of a financial crisis.
Today, analysing the 2021 budgets (the latest available), we investigate the possible signs of a recovery of a downturn originating from the Covid-19 pandemic, while we undergo another crisis, which is still very much ongoing, with a geo-political slant, caused by the ongoing conflict in Ukraine.
Having made this brief but necessary introduction to the scenario, let us present the panel on which Stratego's CSP carried out its analysis this year. The 843 companies surveyed are mainly distinguished by an ATECO code 172 (over 9 billion in revenue) or 181 (around 5.6 billion in revenue), but also chosen because they are relevant and entitled to become 'BIG della Stampa 2021'. The large group was also set a minimum turnover threshold: EUR three million. The cumulative value of panel production was approximately EUR 16.8 billion in 2021 versus EUR14.6 billion in the previous period (Income Statement, item A. Total production value). It is important to emphasise that this first line of the Profit and Loss Account expresses a measure designed to identify all income components generated by the company and takes into account Sales Revenues from Finished Goods, Change in Inventory of Finished and Semi-Finished Goods and Other Revenues and Income. In accordance with Art. 2525-bis of the Civil Code, the relative Revenues from sales and services expresses the result of characteristic operations because it excludes, net of returns, rebates and discounts, inventories, internal work and non-characteristic revenues. In the aggregate of our panel, the total value of production (item A. of the Income Statement) is worth EUR 16.8 billion and the Revenues from sales and services (item A.1 of the Income Statement) are worth EUR 16.1 billion.
A distinguishing feature of the composition of the BIG della stampa 2022 group is the division into Large Enterprises and Small and Medium-sized Enterprises defined according to the rules of the Ministerial Decree. 18 April 2005 'Adaptation of the criteria for identifying small and medium-sized enterprises to the Community guidelines'. This is the result: 60 Large and 783 Small and Medium-sized. Joint-stock companies 78% of large companies and 20% of SMEs; limited liability companies 20% of large companies and 76% of SMEs. The prevailing company form in large companies is the joint-stock company (78%), while in SMEs the limited liability company is the most commonly used (76%).
Total production value per Ateco code
The sample is numerically distributed throughout the country as follows: 31% in Lombardy, 18% in Veneto, 12% in Emilia Romagna. Other Italian regions followed. The same breakdown with decimal differences is also repeated for allocation based on Revenues generated in 2021. Net of the changes filed with the Chamber of Commerce and in any case in relation to what was filed there, 24% indicated business started between 2000 and 2009; 23% between 1990 and 1999; 22% between 1980 and 1989. The panel includes 11 companies created before 1950. The first economic value we compare so we can begin to understand the dynamics of the 2021 results is the comparison with the same periods in previous years, which is 'compulsorily' obtained from the Revenues from Sales and Services (Item A.1 of the Assets in the Income Statement). Aggregating the balance sheet data shows that overall, the panel realised revenues of EUR 16.1 billion compared to EUR 14.1 billion in the previous period, up 13.9%. For this value, from 2017 to 2021, there was only a decline in 2020, which interrupted a positive trend: a decline that was largely recovered in the most recent budgets, attesting to the growth of the 843 companies for the five-year period considered at over 17%. By revenue size classes, the panel of the 843 "BIG della Stampa" companies is segmented as follows: 237 companies with up to EUR 5 million; 248 companies with between EUR 5 to 10 million; 302 companies with between EUR 10 to 50 million; 38 companies with between 50 to 100 million; 24 companies with over EUR 100 million. So the first bit of positive news is that the sector has grown and returned to pre-pandemic levels. Large companies, although they achieved good results, achieved lower growth than SMEs: 10% and 16% respectively. If we glance at the last line of the balance sheet, we can see the operating result before interest, provisions, depreciation and taxes: EBITDA. This is an intermediate figure that is not regulated by the relevant accounting standards but which is advantageously used by companies and those analysing their economic results.
The purpose of this index is to complement the other parameters that define operational performance. For this reason, between company to company, in the respective balance sheets, the reclassification needed to determine this could lead to non-comparable results because they cannot be perfectly superimposed. In our analysis, we present an aggregate figure derived from financial statements using the same calculation criterion. As a result, 2021 was down 1.8% vs. 2021, but the last year was better than 2019 and 2020 at 10.4% in terms of revenue. Operating Profit is also slightly down in 2021 compared to 2020, but also better than in 2019 and 2018. As a percentage of sales, it never strays from values around 5%. Equity in relation to assets of the companies represented in the panel remains at a good level. It decreased slightly last year but has maintained an upward trend since 2017. Among the many economic values or indicators we have analysed, we consider it important to emphasise the value of the human assets employed in companies. In this regard, in the survey conducted by CSP in collaboration with Stratego last November and the results of which were presented at the Print Economic Forum, many of the sector companies questioned had expressed some concern about the increase in labour costs. Let's see if the 2021 numbers show any warning signs of this trend. From 2017 to 2021, the number of staff employed by the companies grew by 13.2 per cent against a 5.6 per cent increase in total revenues. On the other hand, the cost per employee increased by only 0.2% over the period indicated. In 2021, productivity increased by 14.7 per cent to EUR 308.6 million per capita, the highest value in the five-year period. Sixty per cent of the companies analysed employ between 10 and 50 employees, 22% between 50 and 100 employees, and 14.5% between 100 and 500 employees.
Is there a need for new funding? YES 67 %
Another important topic touched upon by the survey is related to the funding of companies that were subject to government action during the worst years of the Covid-19 pandemic. The graph shows the results that emerged in response to the question whether there was a need for new funding. Of course, the answer is yes: in particular, aid was indicated as indispensable to support investments, secondly, to mitigate the cost of rising bills and, finally, to support the stability of the company by supporting its internationalisation. Preferred sources for any subsequent financing are still Banks and the State. There is little demand for shareholder and crowdfunding means. So what emerges from the 2021 budgets in terms of financing? In this analysis, we have considered the balance sheet items other than payables to suppliers and proceeds from inter-company relationships. Aggregating the values, overall, the use of debt noted in 2021 has slightly decreased compared to 2020: with EUR 3.72 billion it returns to the same percentage of the total value of production Another important topic touched upon by the survey is related to the funding of companies that were subject to government action during the worst years of the Covid-19 pandemic.
The graph shows the results that emerged in response to the question whether there was a need for new funding. Of course, the answer is yes: in particular, aid was indicated as indispensable to support investments, secondly, to mitigate the cost of rising bills and, finally, to support the stability of the company by supporting its internationalisation. Preferred sources for any subsequent financing are still Banks and the State. There is little demand for shareholder and crowdfunding means. So what emerges from the 2021 budgets in terms of financing? In this analysis, we have considered the balance sheet items other than payables to suppliers and proceeds from inter-company relationships. Aggregating the values, overall, the use of debt recorded in 2021 decreased slightly compared to 2020: with EUR 3.72 billion returning to the same percentage of the total value of production, playing a prevailing role. In the 2021 budgets, in fact, loans provided by banks account for about 80% of the total, keeping this percentage fairly constant over the five-year period 2017/2021. We also highlight the positive trend in the duration of the business cycle that emerged in this analysis. The year 2021 had 5 more days than the previous year, reversing the growth trend expressed in the period 2017/2021 for the first time. 2021 results at a glance More than 85% of the companies improved their 2021 revenue compared to 2020; 63% of the companies improved their operating profit; shareholders' equity improved in 82% of the companies; 63% improved their operating profit. Only 9.7% of the companies had a negative overall result. Let's touch on the main profitability ratios: ROI (return on all invested capital) and ROE (return on equity) suffered somewhat, dropping by 6.73% and 7.93% respectively, consolidating the trend of the 2017/2021 period. Fluctuating between 5.68% and 4.84%, ROS (return on sales) stands at 4.98% in 2021.
In spite of factors external to the characteristic activities of the companies that have already impacted the results of the companies in the sector since the end of 2019, but even more so in the course of 2021, our analysis shows an overall good health of the business of the Big della Stampa companies. 2022 will not disprove this scenario, although the geopolitical and consequently economic picture continues to complicate matters. Optimism seems to prevail over pessimism, and we expect to see this trend in the coming budgets as well.